


Beyond Poverty: What Growing Income Inequality Means for Halton
Updated: Aug 4
The issue is not simply whether people are poor, but whether more households are being left behind relative to the broader community.

When we talk about community well-being in Halton, the conversation often focuses on poverty. How many people are living below the poverty line? Which neighbourhoods are struggling most? How affordable is housing?
These are important questions. But another issue is increasingly shaping community life across Canada and within Halton: Income inequality.
Poverty and inequality are related, but they are not the same thing.
A community can have relatively low poverty while still experiencing growing inequality. In affluent communities such as Halton, that distinction matters.
Poverty vs. Income Inequality
Poverty measures whether individuals of families have enough income to meet basic needs. Measures such as Market Basket Measure (MBM) or Low-Income Measure (LIM) focus on those living with inadequate income.
Income inequality, on the other hand, looks at how income is distributed across the entire population.
In simple terms:
Poverty asks: “Who does not have enough?”
Inequality asks: “How unevenly is income shared?”
Income inequality has far-reaching consequences for individuals and communities. Statistics Canada 1 notes that differences in income influences households’ ability to maintain their economic well-being, with lower-income households being more vulnerable to economic shocks, rising living costs, and weaker income growth.
One common way to measure inequality is the Gini Index (GI) 2
a GI of 0 means everyone has exactly the same income
a GI of 1 means one person receives all income
What Happened During the Pandemic?
Using Statistics Canada’s T1FF taxfiler data between 2019 and 2023, a clear pattern emerges across Halton municipalities. Income inequality fell sharply in 2020, the first year of the COVID-19 pandemic, before rising again afterward.
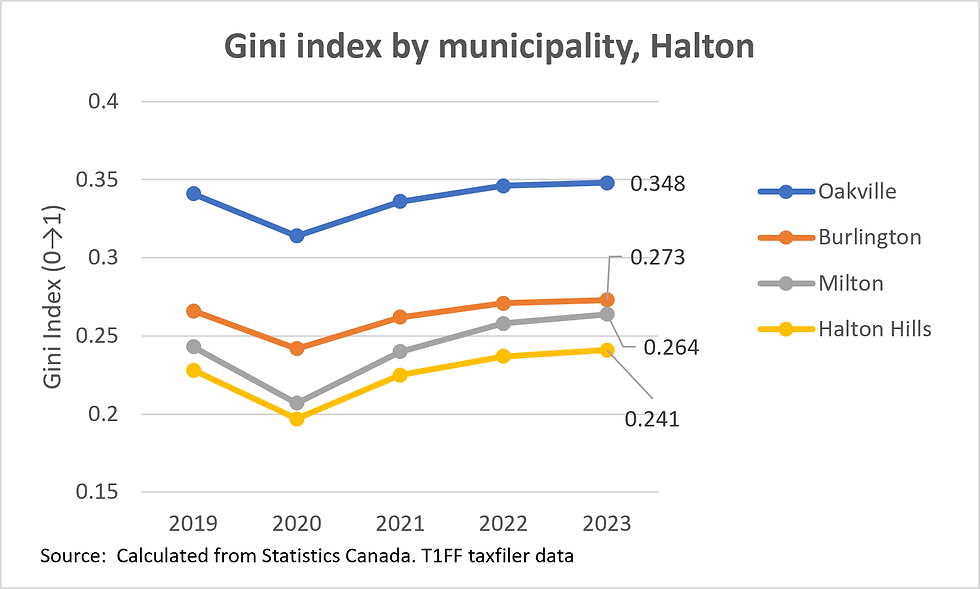
This temporary decline was likely driven by government income supports. These supports disproportionately boosted incomes among lower-income individuals/households, temporarily compressing income inequality.
The decline in 2020 was substantial across all municipalities. However, by 2023, inequality had largely returned to or exceeded pre-pandemic levels. Oakville consistently recorded the highest inequality levels in Halton.
The Gini Index also highlights important differences among municipalities:
Income inequality increased in all four municipalities between 2019 and 2023.
Oakville remained the municipality with the highest inequality in that period
Milton experienced the largest increase in inequality (+0.021)
Halton Hills shows the lowest level of income inequality
The rise in inequality after 2020 may reflect several broader economic trends, including:
Uneven recovery from the pandemic period,
Stronger income growth among top earners,
Housing market related wealth and income effects, and
Widening employment and investment income gaps.
Another useful way to understand inequality is to compare how much income is held by lower-income and higher income groups.
According to the Institute for Research and Public Policy (IRPP) 3, the top 40% of Canadian households held nearly 65% of disposable income in 2023, while the bottom 40% held less than 19%.
Halton’s taxfiler data shows a similar pattern.


Who Holds the Income?
The data also shows how income is concentrated among higher-income individuals (taxfilers).
In Oakville in 2023:
the bottom 40% of taxfilers received only about 19% of all after-tax income while the top 40% received about 65%
the top 10% received 29% of all after-tax income
By comparison, in Halton Hills:
the bottom 40% received about 25% of income
while the top 40% received about 57%
the top 10% received 21% of all after-tax income
The pandemic temporarily narrowed these gaps but the trend reversed after emergency supports stopped. This mirrors broader Canadian trends.
Why Does Income Inequality Matter?
A community can appear prosperous overall while still experiencing widening social and economic divides.
Growing inequality can affect:
housing affordability,
food insecurity,
social cohesion,
health outcomes,
educational opportunities,
and people’s sense of belonging
Research 4,5 consistently shows that highly unequal communities often experience:
greater social polarization,
lower trust,
higher financial stress, and
widening gaps in opportunity.
In communities such as Halton, rising inequality can become less visible because average incomes remain high. Yet averages can hide growing disparities between households.
For example:
rising housing costs may benefit homeowners with significant assets.
While renters, newcomers, younger households and low-wage workers face increasing financial pressure.
The issue is not simply whether people are poor, but whether more households are being left behind relative to the broader community.
Why This Matters for Community Development?
From a community development perspective, inequality matters because it shapes participation, inclusion and resilience.
When income gaps widen:
access to recreation, transportation and community programs may become more unequal,
neighbourhoods can become more economically segregated, and
community organizations may face growing demand for support despite overall regional prosperity.
Understanding inequality also helps communities move beyond deficit-based approaches focused only on poverty.
It encourages broader questions such as:
Who benefits from economic growth?
Which groups are being left behind?
Are opportunities shared equitably across neighbourhoods and populations?
How resilient are households to economic shocks?
The pandemic demonstrated the public policy can significantly affect inequality. Government supports in 2020 temporarily reduced income gaps across Halton and the broader GTHA. But the rebound in inequality after 2020 also suggests that deeper structural forces including housing costs, labour market polarization and unequal asset ownership continue to shape economic outcomes.
_____________
References
[1] Statistics Canada, Distributions of household economic accounts for income, consumption, saving and wealth of Canadian households, fourth quarter 2025, The Daily, 2026-04-13, https://www150.statcan.gc.ca/n1/daily-quotidien/260413/dq260413a-eng.htm
[2]Joe Hassell (2023) Measuring inequity: "What is the Gini coefficient? https://OurWorldinData.org
[3] Institute for Research and Public Policy (IRPP), The troubling rise of income and wealth inequality in Canada, July 2024, https://policyoptions.irpp.org/2024/07/income-wealth-inequality/
[4] Wilkinson, R. G., & Pickett, K. E. (2009). Income Inequality and Social Dysfunction. Annual review of sociology, 35, 493-511. https://doi.org/10.1146/annurev-soc-070308-115926
[5] OECD (2015), In It Together: Why Less Inequality Benefits All, OECD Publishing, Paris, https://doi.org/10.1787/9789264235120-en.


Comments