
Halton Child Poverty Update
- rburke023
- Oct 28, 2025
- 3 min read

By Ricahrd Lau
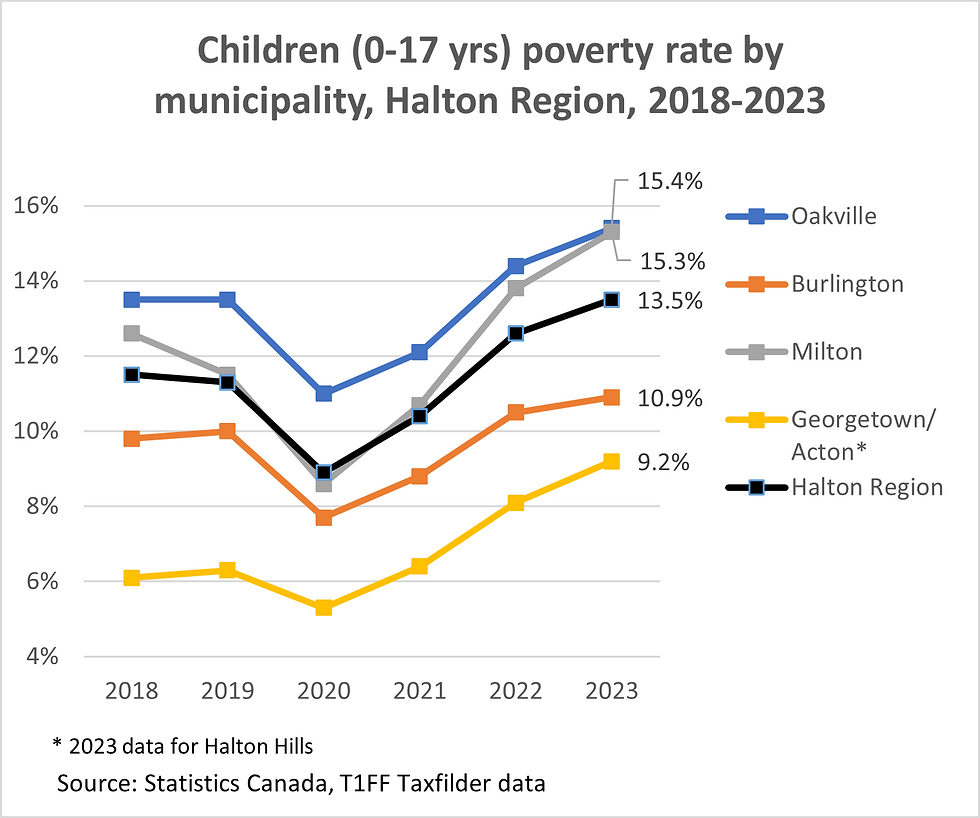
The latest Statistics Canada’s T1 Family File (T1FF) data reveals a troubling rise in child poverty across Halton Region. Between 2018 and 2023, both the number and proportion of children (under 17 years of age) living in poverty increased in every municipality. In 2023, over 13,800 children lived in poverty, or over 1 in 8 children. Halton’s child poverty of 13.5% surpassed the overall regional poverty rate of 13.1%. This widening gap shows that children continue to be disproportionately affected by economic inequality in one of Canada’s most prosperous regions.
A six-year trend of decline and rebound
Child poverty fell sharply in 2020 to 8.9% region wide, likely reflecting the temporary effects of government income supports such as Canada Emergency Response Benefit (CERB) and enhanced Canada Child Benefit (CCB) payments during the pandemic. But the relief was short-lived. As these programs ended and inflation surged child poverty climbed again, reaching 13.5% in 2023, slightly higher than before the pandemic.
The number of children living in poverty in Halton rose from 15,490 in 2018 to 18,590 in 2023, an increase of 20% (or about 3,100 more children). This growth highlights the financial strain families continue to face amid rising housing, food and childcare costs.
Differences across municipalities
Child poverty affects families in every part of Halton, but its impact varies;
• Oakville recorded the highest child poverty rate at 15.4% up from 13.5% in 2018
• The number of children in poverty rose from 6,630 to 7,260
• Milton saw the largest increase, climbing from 8.6% in 2020 to 15.3% in 2023
• The number of children in poverty rising by nearly 2,800 in five years
• Burlington maintained a lower rate but still rose from 7.7% in 2020 to 10.9% in 2023
• Halton Hills recorded the lowest rate at 9.2%, up from 6.1% in 2018

Where child poverty is concentrated
The distribution of child poverty is not even across the region. Comparing each municipality’s share of the region’s children to its share of children in poverty reveals where child poverty is more concentrated.

Oakville and Milton show overrepresentation of child poverty
Oakville accounts for 34% of Halton’s children population but 39% of those in poverty, a five-percentage point gap
Milton has 30% of children but 33% of those in poverty, a 3.5-point gap
Burlington’s share of Halton’s child poverty (21%) is below its share of all children
Halton Hills shows a similar pattern with a -3.2-point gap.
The rebound in child poverty after 2020 signals that temporary pandemic supports were not enough to create lasting change. Rising living costs continue to erode family well-being. Some recommendations to address the devastating impact of child poverty include:
Strengthening income support (bringing Ontario Works and Ontario Disability Support Program rates up, so families are no longer living under the poverty line),
Move from a minimum wage in Ontario to a Living Wage,
Expanding affordable housing and ensuring strong policy for affordable housing is in place, and
Ensure affordable childcare in Ontario with a cap at $10/day and ensuring benefits like the Ontario Child Benefit and Canada Child Benefit CCB keep pace with costs.
These, plus other steps are critical steps toward reducing child poverty in Halton.
To read more recommendations see: Tackling Child Poverty: A Call for Bold Solutions. 2024 Report Car on Child and Family Poverty in Ontario. Campaign 2000
What can you do right NOW?
Like in Halton, the Ontario poverty numbers for children continue to trend up for children (and other population groups). Under the Poverty Reduction Act, 2009, Ontario is required to assess it Poverty Reduction Strategy at least every 5 years, the develop and issue a new poverty reduction strategy based on the assessment that is conducted. The Province is seeking feedback as they renew the strategy – with comments du from organizations and the public by November 20, 2025.
You can provide feedback here: Consultation: Poverty reduction strategy | ontario.ca


Comments